WHO’s most recent atlas of air quality leaves significant gaps in coverage
The World Health Organization (WHO) recently released its latest global urban air pollution database, including information for nearly 3,000 cities—a doubling from the 2014 database, which itself had data from 500 more cities than the previous (2011) iteration. These increases in coverage in air pollution measurement and reporting is encouraging, but the WHO numbers reveal that we still have a ways to go to construct a comprehensive and accurate picture of global air quality.
WHO singles out Onitsha, Nigeria and Zabol, Iran as the cities with the world’s worst air pollution, the first for elevated coarse particulate, or PM10, levels and the second for extreme fine particulate, or PM2.5, concentrations.
Yet these dubious rankings come with many uncertainties and stir more questions than they answer. “It is difficult to get accurate measurements in Africa,” a WHO spokeswoman said. “[I]deally the measurements should be done over a year to include different seasons and times of day. The reading in Onitsha may be representative but not altogether reliable.”
The air in Onitsha and Zabol is, in other words, bad, though just how bad we cannot say with certainty. Global air quality is worsening, human exposure to air pollution is on the rise, and deaths caused by these toxins have increased from 4.8 million in 1990 to 5.5 million in 2015. These trends are not, however, represented evenly throughout the world. Developing nations, those experiencing rapid industrial and urban expansion, bear the brunt of air pollution’s pernicious effects. The air in cities like Onitsha and Delhi has worsened as their populations and polluting industries have grown, while New York and London’s air quality has steadily improved.
And yet it is developing cities and nations that are least equipped to monitor and manage their ambient environment. WHO’s latest air quality database underscores this problem, as nations with the most resources have steadily increased air quality monitoring and reporting and have seen their air quality steadily improve. Developing countries have experienced deteriorating air quality alongside economic growth, as measurement in these places lags behind.
The vast majority of ground-based monitors are located in Europe and North America meaning there are major “blindspots” obfuscating where air pollution is affecting the most people in the most pernicious ways. These blindspots are why we need new ways to monitor global air pollution. The 2016 Environmental Performance Index (EPI) reveals the extent to which ground-based air monitoring and reporting is missing areas suffering from some of the world’s worst air pollution. Using satellite data, researchers at Dalhousie University have estimated ground-based exposures to fine particulate pollution or PM2.5—microscopic particles that can penetrate deep into human lung and blood tissue, leading to cardiovascular disease and other serious health impacts.
These satellite data have advantages as well as their disadvantages compared to ground-based information. Satellites offer a globally-consistent, long-term, and dynamic view of air pollution levels, exposures and trends. Satellite data provide a picture of the average PM pollution that an individual living in a particular place would be exposed to on a typical day, potentially smoothing out outlying spikes in air toxin concentrations. These data can be used to gauge pollution’s impacts on human health – in total, Global Burden of Disease estimates outdoor and indoor air pollution is responsible for 5.5 million premature deaths a year. Satellites do not, however, measure air pollution at the ground level, where people live and breathe, which is why governments need to invest in ground-based monitors.
Here we present four visualizations from Data-Driven Yale’s latest research on global air pollution and a fifth graphic from recent studies on pollution sources with original analysis:
1. Nearly half of the world’s people breathes unsafe air, with populations in developing countries disproportionately exposed. One-third (1.3 billion) of these people live in the East Asia and Pacific region, where in China and South Korea more than 50 percent of their populations are exposed to unsafe levels of fine particulate matter. In India and Nepal, the percentage is nearly 75 percent – a figure reinforced by WHO’s 2016 database, showing that 16 of the world’s 30 most polluted cities are in India. In our interactive map areas shaded red or darker experience air pollution that exceeds 10 micrograms/m3 – the threshold WHO considers unsafe for people to breathe. The map shows that East Asia, Northern India, and Northern Africa have the world’s highest levels of fine particulate pollution.

GLOBAL EXPOSURE (IN MICROGRAMS PER CUBIC METER) TO FINE PARTICULATE POLLUTION (PM.5).
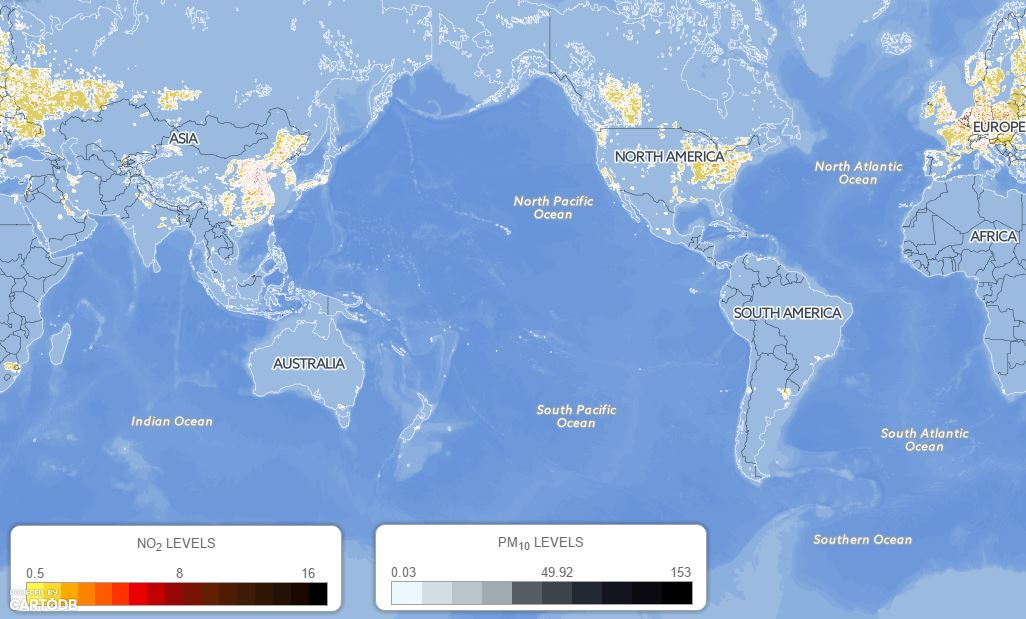
2. Nitrogen dioxide pollution, produced mainly from fossil fuel combustion, is a precursor of ozone and smog and mostly affects Europe and East Asia. In Europe, tax policies dating back to the 1970s and regulations from the 1990s designed to limit tailpipe CO2 emissions have encouraged the production and use of diesel vehicles, resulting in elevated NO2 levels. While diesel vehicles generate 15 percent less CO2 than their gasoline counterparts, diesel engines emit four times more NO2. In London, NO2 pollution is linked to 9,500 deaths annually. These data, derived from satellite estimates, show that air pollution is not only a developing world problem, but that industrialized countries also suffer from foul air. European cities, however, are implementing ambitious policies to reduce air pollution, such as the British capital’s Ultra Low Emissions Zone, which is expected to cut central London’s pollution in half by 2020. Overall air quality has improved in Europe in the last decade, while pollution continues to worsen in most of Asia, Africa, and Latin America.

GLOBAL EXPOSURE (IN PPM) TO NITROGEN DIOXIDE (NO2).
3. Global monitoring is improving, primarily in developed countries. Figure 3 shows increases in the number of cities monitoring air pollution from the WHO’s 2011, 2014 and 2016 databases. Cities monitoring air pollution have increased in number to the greatest extent in Europe and high-income countries in the Americas in the last five years. Progress in lower to middle-income countries has been much slower.

NUMBER OF CITIES WITH AIR POLLUTION DATA IN WHO’S URBAN AIR POLLUTION DATABASE IN 2011, 2014 AND 2016. DATA SOURCE: WORLD HEALTH ORGANIZATION
4. Governments that have implemented policies to control air pollution have reduced deaths. New data released in February of this year as part of the Global Burden of Disease (GDB) project show that 5.5 million premature deaths occur each year due to air pollution. Looking at GBD data over 10 years (Figure 4), key trends emerge. Air pollution-related deaths in Latin America, Sub-Saharan Africa, and Southeast Asia have worsened more dramatically than other regions the last decade. The United States, European Union, and Australia have significantly reduced air pollution-related deaths, largely due to policy interventions targeted at industrial pollution control, reducing fossil fuel consumption, and improving fuel quality in the transport sector.

PERCENTAGE DIFFERENCE BETWEEN AIR POLLUTION-RELATED DEATHS IN 2000 AND 2013. DATA SOURCE: GLOBAL BURDEN OF DISEASE (GDB)
5. New sources of air pollution detected. Recent studies show that a major contributor to air pollution is shipping. This finding is particularly salient in coastal regions in East Asia. Forty-two percent of Hong Kong’s particulates, for instance, are from the maritime sector. And East Asia has experienced the highest number of shipping-related air pollution deaths. A new study shows that air pollution from the agriculture sector exceeds anthropogenic sources of particulate pollution in the United States and Europe (Figure 5). These studies underscore air pollution’s complex origins, as airborne toxins come from many different sources and activities, both natural and human-driven. The mix of sources makes it ever more challenging to design policies and interventions to address this class of pollutants. Despite the challenges, the imperative is clear: more efforts must be made to reverse the current trends, to reduce human exposure to air pollution and to improve global air quality.

DOMINANT CONTRIBUTOR TO PM2.5 CONCENTRATIONS WITH RESPECT TO NATURAL (BEIGE), ANTHROPOGENIC (WITHOUT AGRICULTURE IN RED), AND AGRICULTURAL SOURCES (GREEN). SOURCE: BAUER ET AL. (2016).
http://blogs.scientificamerican.com/guest-blog/a-new-air-pollution-database-is-good-but-imperfect/